Summer 2013
The Global Implications of Shale Oil
I. Introduction
The US “shale revolution” in oil and gas, and unconventional oil production in North America more broadly, are increasingly recognized as consequential beyond energy markets, and for years to come. Yet, the assessment of its strategic importance in geopolitics, the global economy, or the environment is trailing actual developments – perhaps unsurprisingly so, given the large degree of uncertainty still surrounding the assessment of future production growth.
Over the last five years the bulk of global oil production growth was not provided by OPEC, and not by Middle Eastern countries, but by the US and Canada. Nearly all of it was what our industry likes to call “unconventional” oil – produced from oil sands, mostly in Canada, shale in the US, and a sprinkle of biofuels (without counting deep water production). We expect this to continue through the current decade.
Last year, the US recorded the world’s largest increase in oil as well as in natural gas production. In oil, this was the largest annual increment in the country’s history – a history going back to 1859.
Nearly all of it was tight oil, i.e. oil produced by applying the same technologies (horizontal drilling and hydraulic fracturing) that gave us shale gas. US oil production grew by over 1m barrels per day (Mb/d), 80% from North Dakota and Texas, home to the country’s most prolific tight oil formations. As of last year, 2.1 Mb/d (24%) of US oil production came from tight oil (and 37% of natural gas from shale). Shale resources have boosted output by 30% in the past five years (and natural gas by 20%). So far this year production has grown even stronger: the US may replace Saudi Arabia as the world’s largest oil producer, perhaps as early as next year.
The following is an attempt to preliminarily assess the most important implications that emerge from this shift in global energy. Section II provides necessary context, including a production profile out to 2030. Section III discusses five of the most important strategic implications. The discussion centres on oil (as opposed to natural gas) markets to the extent possible.
II. Characteristics
The first observation to make is that these developments are big already.
The changing nature of US import requirements provides an example. Net US oil imports peaked in 2005 and have since fallen by 45% or 5.5 Mb/d. This reduction is considerably larger than the entire oil consumption of Japan; the world’s third largest oil consumer, last year. The laws of economics worked both ways: About two thirds of the decline in US oil imports are due to higher domestic production, the remainder is owed to declining consumption in the wake of a decade of high and rising crude prices.
Over that same period Chinese net oil imports rose 84% (2.8 Mb/d), with China well on its way to overtaking the US to become the world’s largest oil importer. Just a few years ago, US imports were on a par with Europe’s. Today, they are one third below those of the European Union.
A second observation relates to the spatial distribution of shale resources.
Different from conventional oil, shale resources appear to be widely spread across regions. Resource assessments are still in their infancy and incomplete. However, the latest tally of the International Energy Agency shows technically recoverable shale resources (for oil and gas) in Asia exceeding those in North America; and a large extent of resources present in South America, Africa, Europe and Eurasia. (The IEA puts the grand total at 240 billion barrels of tight oil and 200 trillion cubic meters of shale gas.) Granted that we know little about the economic recoverability of these resources, it still looks like a comparatively even distribution – and, compared with conventional reserves, one that is remarkably present in regions where oil is actually consumed.
Despite the relatively even spatial distribution of accessible resources, however, most forecasters — ourselves included – predict production for the foreseeable future concentrated in North America. In our own forecast, unconventional liquids (US tight oil, Canadian oil sands and biofuels) will account for all the net growth in global production this decade.
This apparent disconnect between resources estimates and production forecasts gives rise to another important observation. Why is it that of all the countries in the world, this breakthrough in the production of unconventional crude was achieved in the US and (in the case of oil sands) Canada? Surely no one had those two on the radar just a few years ago?
The intuitive answer would be that this is where the resources lie. We have all heard about prolific shale formations in the US and Canadian oil sands. And typically, this is how the story is told — a massive North American resources base meets the technology needed to access it. But this misses an important reality.
Venezuela has at least as much heavy oil as Canada. Yet, nothing came out of Venezuela in response to ten years of high and rising prices. China, many geologists will tell you, has shale resources on a par with those of the US. But again, nothing came out of China. The analogy could be carried further, comparing offshore production in the Gulf of Mexico between Mexico and the US. The development of technologies that made the shale “revolution” possible was a textbook example of how high prices in competitive markets can drive technological change.
It is more accurate to tell the story of shale with three ingredients: a massive resource base; a decade of high and rising prices; and, most importantly, a competitive environment, allowing entrepreneurs to take a gamble to connect the two.
Everyone can invest in oil and gas in the US or Canada – and many did. In the event, mostly small or medium sized firms tried to develop technologies that would connect high prices and known shale formations — first for gas, and then for oil. Many failed and lost their shirt in the process. A few succeeded. But the big multinational oil and gas corporations came in only once the basic technologies had been developed – to buy them, and to apply them elsewhere.
In this way, the shale revolution really is an example of what economists grandly refer to as a “Schumpeterian” process (also known as Economics 101): High prices under market conditions trigger competition, and competition triggers innovation. There are victims among those who move in first, and there is a wave of followers who come in next, catching up with the new technologies and refining them further to make them more efficient, until the system stabilises again.
The US is now reaping the second round effects of this wave of innovation: After access to a massive resource base has been granted by technological advancements, and the boom triggered, efficiency improvements have emerged: In North Dakota, for example, the number of new wells started in 2012 grew by more than 50% and so did the state’s oil production – but the number of rigs grew by only 10%. Producers are getting more oil out of the ground at less cost.
The most important lesson one can hope to learn from these developments is what they mean for energy markets generally: That energy markets are governed by the very same simple principles as any other market. They are not different.
There is therefore a reason this “revolution” happened in the US or Canada and not, say, in Venezuela or China (or Mexico). It has nothing to do with resource endowments below ground but everything to do with competition and markets above ground.
Other, practical, factors have been important too. But they do not take away from the principal role of competition. They reflect competitive conditions. Production from shale formations is well intensive and the US has the infrastructure to tackle this – the world’s largest drilling fleet (1800 rigs, and most of them capable of drilling horizontally). The US also has a system of property rights in which private owners of land own the mineral subsurface rights and can sell directly to companies (in other countries, these rights to assets below ground as a rule are owned by government). This proved to be a very important ingredient in the development of shale resources because it made it possible for companies to buy the resource rights directly from farmers and other property owners, rather than waiting for government as a go-between. It also helps to have deep financial markets, allowing investors to hedge, or a large number of competitive energy companies.
A forward-looking discussion of political or economic implications needs a suitable benchmark for future production growth. Figure 1, taken from BP’s Energy Outlook 20301, provides a summary of our production profile out to 2030.
It is built around the assumption that global liquids production (oil plus biofuels) by 2030 will reach 104 Mb/d, an increase of about 16 Mb/d from the Outlook’s base year 2011. This is in the ballpark of other estimates. We assume that tight oil (at 7.5 Mb/d) will account for half that global increase until 2030.
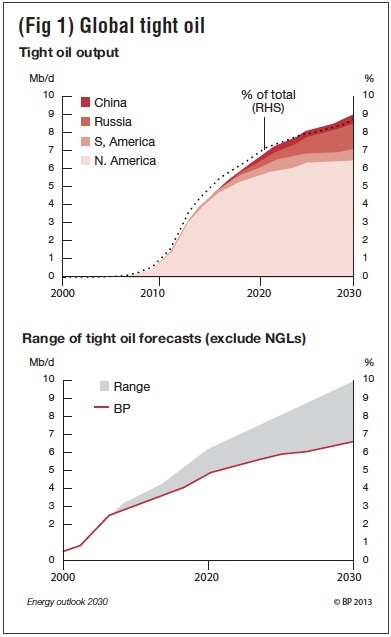
Figure 1 shows only the production profile for tight oil. It is based on our view of the geology, the resource base, infrastructure needs and the cost and drilling activity required to sustain production – also embedding, of course, an assessment as to the speed with which shale resources are likely to be accessed around the world, including market, political and infrastructure bottlenecks.
In our Outlook, tight oil production, literally coming out of nowhere and ramping up from zero, will account for 9% of global supplies by 2030. The bulk of it will still be produced in North America. Russia and China are expected to start developing their tight oil resources, reaching 1.4 Mb/d and 0.5 Mb/d by 2030, respectively. South America will also increase output due to investment in countries like Colombia and Argentina.
This production profile has three important characteristics:
Production remains heavily dominated by North America (mostly the US).
Global production rises throughout the forecasting period, but growth decelerates after around 2020. This slowdown is driven by decelerating growth in North America post-2020, based on today’s view of the resource base and the cost and drilling activity required to sustain output.
Other countries enter tight oil production during the forecasting period, most notably Russia and China. Their contribution accelerates over time but not enough to reverse the overall profile of slowing production growth after 2020.
How does one evaluate a freshly minted production profile – a point forecast — in an area fraught with such uncertainty? One idea is to compare it with everybody else’s forecast. The shaded area on the right hand side of figure 1 shows the result. It turns out (and was a surprise for us) that BP’s tight oil forecast lies at the very bottom end of the range of all the other forecasts we could find. In fact, we had trouble finding lower estimates.
The conservative nature of our production forecast has two dimensions: In general, the forecast is lower at any point in time than almost anybody else’s; in particular, the decelerating characteristic of the production profile is not shared by many others who see steady growth or even acceleration.
Both points are important. They imply that the global implications of the shale “revolution” discussed below would have to be amplified if the optimists are right. These modifications would be particularly severe for trends after 2020, when we have slowing production growth.
Five Main Implications
1. Global oil markets
One of the first questions these developments pose is about their impact on global oil markets, and in particular, on the price of crude.
In a normal market the answer would be straightforward. Prices should fall and the remaining issue would be to calculate how fast and by how much. But the market for oil is not a “normal” market. It features a producer cartel – OPEC — with a long history of successfully managing its production in pursuit of a variety of goals — not least presumably to maximize the long-term revenues of its member states. In oil markets, the question of the impact of additional tight oil supplies on price translates seamlessly into the question of how OPEC is likely to react.
This is an area of uncertainty, but there are good reasons to assume (as we did in the Outlook) that OPEC members are willing and capable to react with production cuts to rising non-OPEC supplies. If they do, declining demand for OPEC oil will be accommodated by production cuts, which in turn leads to spare capacity. The build-up of spare capacity required to neutralize the additional tight oil supplies (plus biofuels and oil sand production) is substantial indeed.
In BP’s Outlook, demand growth slows and non-OPEC supplies rise – both a result of high prices. Unconventional non-OPEC supply will account for all the net growth in global production over this decade, and for over 70% of the growth from 2020–30. With OPEC members cutting production to accommodate new supplies in line with our production profile, spare capacity will exceed 6 Mb/d in this decade — the highest since the late 1980s.
The market requirement for OPEC crude will not reach current levels again for a decade. Thereafter, as consumption keeps growing and if tight oil growth slows in line with our production profile, the requirement for OPEC crude recovers. OPEC production can rebound and spare capacity shrinks.
This will be no easy task for OPEC. The cohesion of the organisation is the key uncertainty to this scenario, especially in the current decade. This will be a world in which Russia, the US and Saudi Arabia each have the potential to produce upward of 10 Mb/d, together a third of global production. Of the three, only Saudi Arabia can be expected to incur the cost of maintaining large amounts of spare production capacity. But Saudi Arabia is situated between Iraq, an OPEC member without a quota, where production is likely to increase steadily and Iran, for which no one can predict how long the impact of sanctions will limit production.
It is unlikely, on the other hand, that we will see a repeat of the oil price collapse of a few decades ago — even without reference to political turmoil in the Middle East (which of course has the potential to derail the outcome discussed here). Because of its high well density, tight oil production is eminently scalable; and we have just witnessed how rock bottom prices for natural gas affected the supply growth of shale gas.
But as a first order effect, there will be pressure on the configuration of oil markets – in particular, on OPEC’s ability to manage these markets.
2. Energy Policy
The second implication involves the role of politics in removing the uncertainty about tight oil production over time. It is a corollary of the widespread availability of shale resources on the one hand, and the crucial role of energy policy in getting them to market on the other.
Even at present, oil production and market structure are subject to much more than resource distribution (and control of concentrated resources) below ground: There is, for example, a systematic tendency of oil importers to approach their reserves in a much more aggressive way than exporters do, with production/reserve ratios higher for the former. The role of “above ground” political decisions in determining resource access is likely to rise to new heights in the matter of tight oil – reflecting the interplay between the relatively even spatial distribution of these resources and the role of free entry and competition in accessing them.
The signs are visible everywhere. Poland and the Ukraine are competing aggressively for investment in shale exploration. France and Bulgaria, at the other extreme, have put into place moratoria on fracking, thus eliminating the prospect of oil and gas extraction from shale formation. Germany is debating which areas to open, and the UK is considering financial incentives to communities with shale prospects.
In China, lack of success to date in accessing shale gas as planned is attributable largely to an uncompetitive energy sector, with preferential allocation of areas with good prospects to national monopolies and high barriers to entry for everyone else, including companies with better technologies or less risk aversion, be they domestic or foreign. Russia – facing an interesting trade-off between pursuing the entirely new technological challenges required for shifting production into the Arctic and allowing for cheaper trial and error mechanisms in accessing known shale plays – is hesitantly reforming its tax sector in support of the latter. Even in the US, production from shale formation is concentrated in the middle of the country, leaving large known fields in California and upstate New York untapped for now, because of environmental concerns.
All these examples reflect above ground, political considerations, usually mirroring local attitudes towards free access, competitive energy markets, or the environment. We should expect more of the same. It would be going too far to speak of a primacy of politics over the search for accidentally distributed resource endowments, but increasingly decisions determining which resources will be brought to market will be made in town halls and parliaments, rather than ruled by the the capricious design of nature in allocating conventional oil endowments.
3. Geopolitics
The third implication has been most widely recognized. It concerns the geopolitical and strategic consequences of shifts in the established centres of production and consumption — best exemplified perhaps by the role of the Middle East.
We all grew up in a world in which oil was the central fuel, and the Middle East was the world’s central oil supplier. For better or worse this had huge political consequences, especially for relations between the world’s largest oil consuming nation and this regional supply centre: there has been a special two-way relationship between the US (and the OECD more broadly) and small Arabian economies which happen to be large oil producers.
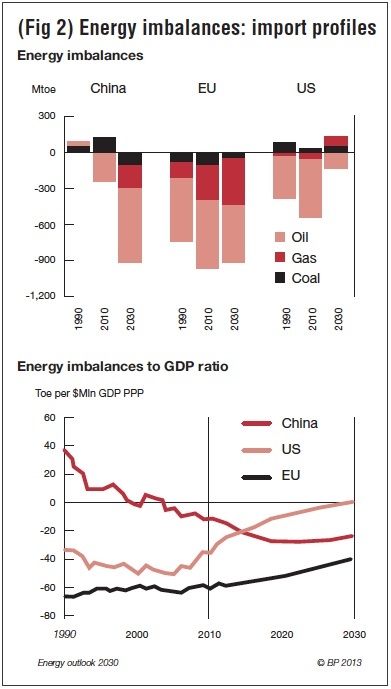
Figure 2 illustrates how these relations may be about to change. Implausible as it may sound, twenty years ago China was a net exporter of energy. By 2030 it is likely to have become the world’s single largest oil (and gas, and coal) importer, relying on imports for 77% of its oil and 42% of its gas. Europe, over the same period, is likely to remain a large importer of fossil fuels as well.
The US faces different prospects. Taking the production profile in our Outlook as a guide, it should nearly be self sufficient in energy by 2030. North America as a region – also comprising Mexico and Canada – is likely to achieve this landmark even earlier. The US already is a net coal exporter and this is unlikely to change. There is little doubt that it will become a natural gas exporter relatively soon. And while, in our conservative production profile, it will still be a net importer of oil, these imports will have fallen by 70%.
What does this mean? Is it conceivable (this is definitely not a prediction) to imagine a future American President looking at this troubled region and thinking “No skin of my nose? I only need little oil – and the little I need I can get from Canada and Mexico?” Perhaps it is. But it is also unpredictable.
What seems clear is that nature, markets, and presumably politics are not fond of a vacuum. We cannot know whether one will emerge, nor how it would be filled. But the geopolitics of energy relations as we know them are shifting.
4. Economics
So far, the public discourse around the economic implications of shale oil and gas has largely been concerned with the question whether cheaper energy (and, by extension, electricity) prices will give the US a competitive advantage in industrial production, or may even trigger an industrial revival of the US. In the grand scheme of things, however, this is rather a peripheral issue.
Most economists would agree that one of the most persistent threats to global economic stability lies in what has come to be known as global imbalances. The term refers (mostly) to the need to finance a US current account deficit (combined with an equally persistent fiscal deficit) with capital inflows from countries that have an external surplus. The most prominent example, of course, is China. But the US also imports capital from the Middle East and other export oriented economies. The risk associated with this situation is that rolling over these financing needs may eventually prove unsustainable, in particular since the US may gradually lose the advantages that come with being the holder of the sole global reserve currency. Global financial instability could result.
The energy imbalances discussed in the last section carry the potential of alleviating these balance of payment imbalances. Today, energy imports still account for fully 54% of the external US deficit in goods and services. Ceteris paribus, the trend toward self-sufficiency in energy will diminish this deficit (it will also help the fiscal situation). By the same token, rising energy imports will lower the Chinese trade surplus. Should lower oil prices materialize, this would leave a dent in the current account surplus of Middle Eastern oil producers as well.
All of a sudden, a force for good seems to have emerged and from an unexpected angle – from energy markets, going some way to support a rebalancing of the global economy.
All other things need not stay constant, of course. The US could decide to import more of something else instead of energy. Complicated exchange rate effects will have to be evaluated before contingent conclusions can be drawn. No one has yet attempted to assess this global macroeconomic impact of shale oil and gas in detail. One point is obvious, however. Even with our moderate production profile, the scale of this global economic impact promises to be huge – large enough to make such an assessment urgent and necessary. The balance of payment effect will dwarf the dispute about energy prices and US competitiveness.
So the shale revolution is likely to leave a considerable footprint on the global macroeconomic landscape. At first sight at least, this looks like decidedly good news for the global economy.
5. Environment
The shale revolution also marks a decision point for those of us interested in the environment. To generate a kilowatt-hour of electricity with a modern gas-fired power plant leaves about 50% less carbon emissions in the atmosphere than coal fired generation. The consequences are stark and visible already:
Last year, of all the economies in the world, the US recorded the largest decline in CO2 emissions – not as a result of conscious climate policy but because of the massive displacement of coal in power generation with cheaper shale gas.
In the EU, in contrast, carbon emissions fell marginally and only as a result of lower energy demand in the wake of economic recession. Carbon intensity – the amount of carbon emitted per unit of energy – rose, as Europe’s economies replaced gas in power generation with cheaper coal, imported from the US.
US coal is currently being chased into exile by the shale “revolution”. Replaced by cheaper shale gas at home, coal is shipped to Europe, where it replaces expensive European gas imports (mostly of liquefied natural gas) in power generation. The foregone gas imports, in turn, bypass the old continent for Asia, where they are wanted at premium prices – among other uses, to substitute for the lack of nuclear power in Japan. Meanwhile, European power generation creates an unfortunate mirror image of the US pattern: In Europe, the share of coal rises and the share of gas declines; in the US, it is the other way round. Both processes involve sizeable quantities; and the consequences for carbon emissions are obvious.
It is an interesting sub-story why European climate policy and carbon pricing was unable to prevent this substitution.2 But this (still ongoing) episode also harbours a more direct lesson.
The sheer order of magnitudes, with gas and coal accounting for about a third and a quarter of global energy consumption, respectively, and renewables less than 2%, inescapably leads to the question of whether CO2 targets are not better served by advocating more global substitution from coal to natural gas, including shale gas, rather than by the gradual and expensive build-up of renewables alone. The argument to make better use of scale and global trade – for example by taking carbon pricing seriously — is strengthened by the efficiency with which the two fossil fuels are traded across borders, something not yet possible with wind and sun.
This then leads to the decision point for environmentalists. What is it going to be, fear of fracking or the conscious replacement of more coal on a global scale by natural gas, including shale? One is a local problem; the other is a global one. I have my own suspicions about the outcome.
NOTES
1. On the 2013 version of which most of the following is based [http://www.bp.com]
2. This story is traced in the 2013 presentation of BP’s Statistical Review of World Energy [http://www.bp.com]
Christof Rühl is Group Chief Economist and Vice President of BP