Winter 2011
Money in the Wrong Places: What Marx Got Right
A giant suction pump had by 1929–1930 drawn into a few hands an increasing portion of currently produced wealth. In consequence, as in a poker game where the chips were concentrated in fewer and fewer hands, the other fellows could stay in the game only by borrowing. When the credit ran out, the game stopped.
Marine Eccles Chairman of US Federal Reserve 1934–1948 explaining how rising inequality caused the Great Depression
Back in the American car industry’s tail-finned Fifties, Henry Ford II took Walter Reuther, the leader of the auto workers union to see his latest plant in Detroit. It was just after the UAW had gained another big rise in pay and benefits for its members so Ford may have wanted to make a point. The plant contained the first primitive prerobots replacing workers in some jobs and Ford asked Reuther a question. Pointing at the machines he said: “Tell me Walter, how are you going to get them to join your union?” “I don’t know, Henry”, Reuther replied. “How are you going to get them to buy your cars?”
That exchange illustrated the basic bargain at the heart of the post-war economic consensus. Workers in factories and offices were well paid and they needed to be for the economic system’s health. For without demand supply is useless and in a mass production economy that means the demand has to come from the mass of the population. And for the mass of the population to buy things they have to have the lion’s share of the countries income. That was truer in the 1950s than ever before in history and US consumers responded by buying everything America could make and becoming the consumer of last resort for the rest of the world as well.
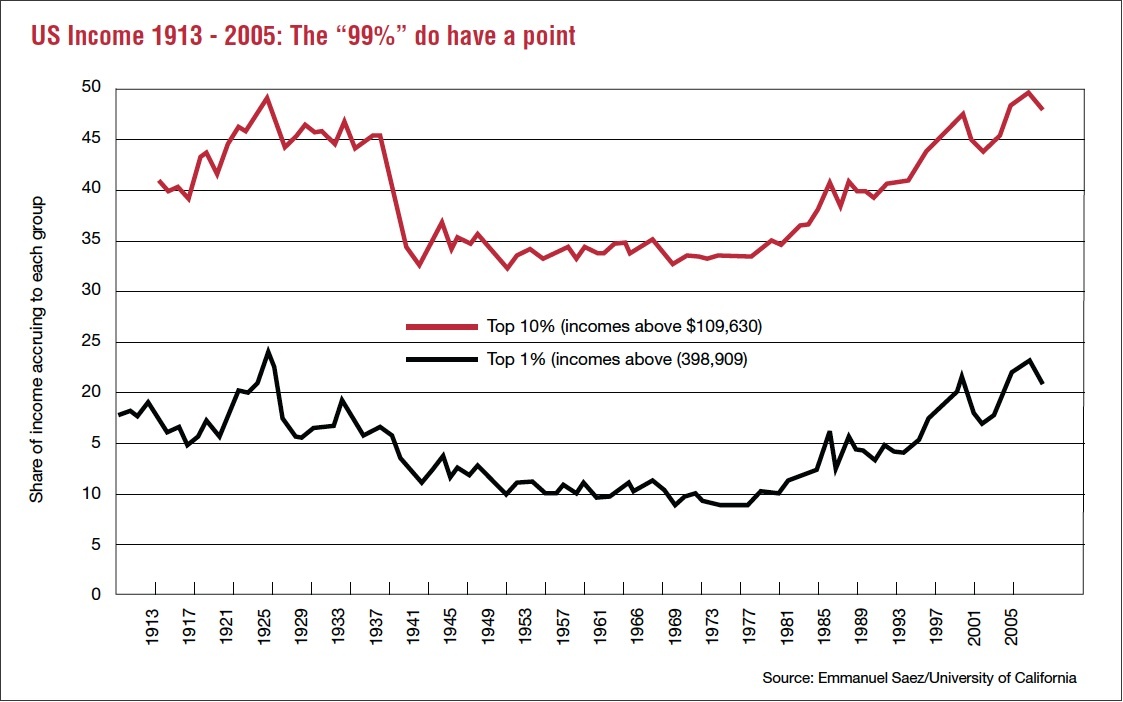
Source: Emmanuel Saez/University of California
Ford and Reuther were talking shortly after a remarkable period in the 1940’s often referred to as “The Great Compression.” The inequalities of wages and wealth in the US and in the rest of the world saw an extraordinary narrowing. Some of it was caused by the burst of growth in demand for unskilled labour during the war, some by tax policy, which took more money from the rich (and thus reduced the incentive to seek high income) and some by forces, which we still don’t understand.
This equality survived the low inflation of the 1950’s, the sharp growth of the 1960’s and the high inflation mess of the 1970’s. But from 1980 the great compression went into reverse. Income and wealth inequality have grown steadily in the advanced economies.
To see how, fast forward to this year. The US companies are shadows of their former selves with Ford the only one of the Big Three to have avoided bankruptcy and that only by relentless hacking at the benefits which it granted in its wealthier days. The new elite of industry deal on a smaller scale. Apple became the most highly valued company on the US stock market earlier this. What would its boss say to the modern Walter Reuther.
The short answer is nothing because the modern economy is largely union free and there are no Walter Reuthers any more. Nor would there be any point in going to Detroit or anywhere else in the US because the things for which Apple is famous are all made in China.
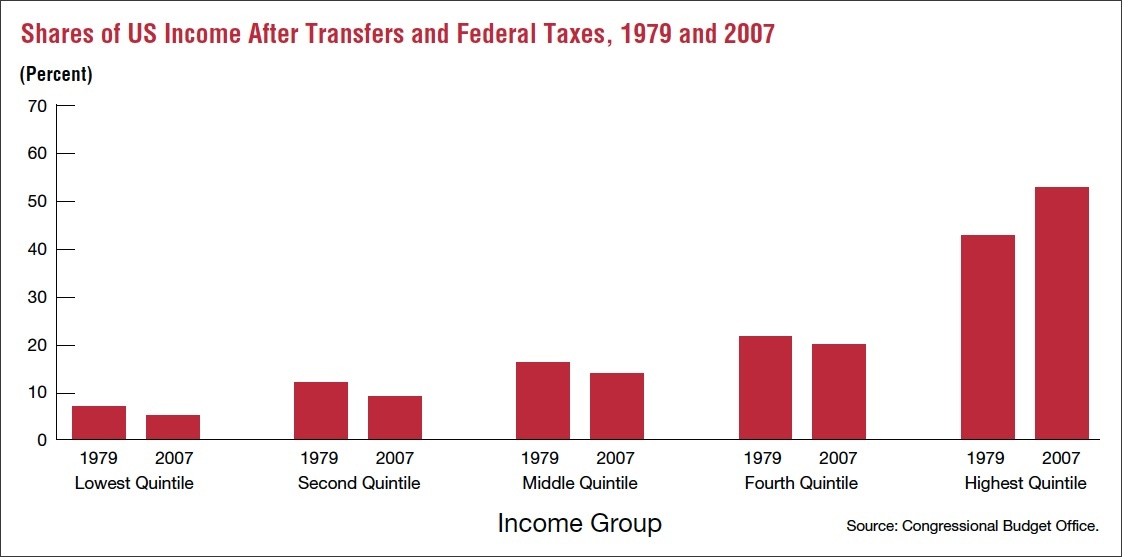
Source: Congressional Budget Office.
The grandchildren of the people Walter Reuther represented are either working in smaller companies, the government sector or not working at all. Whichever they are, their experience has been the same. If they are on average earnings or less, their real incomes have been stagnant or falling for the past 20 years. If they are in the bottom 80 % of the population their share of national income has gone down sharply. If they are in the 19% above that, they have kept their share steady. It is only in the top 1% that gains have been made and for those in that group the gains have indeed been spectacular.
How has this happened? What are the economic and social consequences? And can or should anything be done about it?
The forces, which brought about this change are many and varied. Some are technological. More advanced production methods reduce the demand for manual labour. New products often are cheap to produce but fetch a high price. The marginal cost of producing another copy of Windows 7 is extremely low, leaving substantial margins for intellectual property. This is a “winner take all” part of the economy. While they last, the dominant companies can earn huge profits, and in many cases the ownership of such companies as Facebook is highly concentrated, leading to enormous fortunes.
Technology is at most only part of the story however. Traditionally in history technological progress produces gains, which are shared throughout the economy. As Ford speeded up the assembly of cars, so he increased the pay of car workers. Why is it that during the past 30 years we have not seen a similar process?
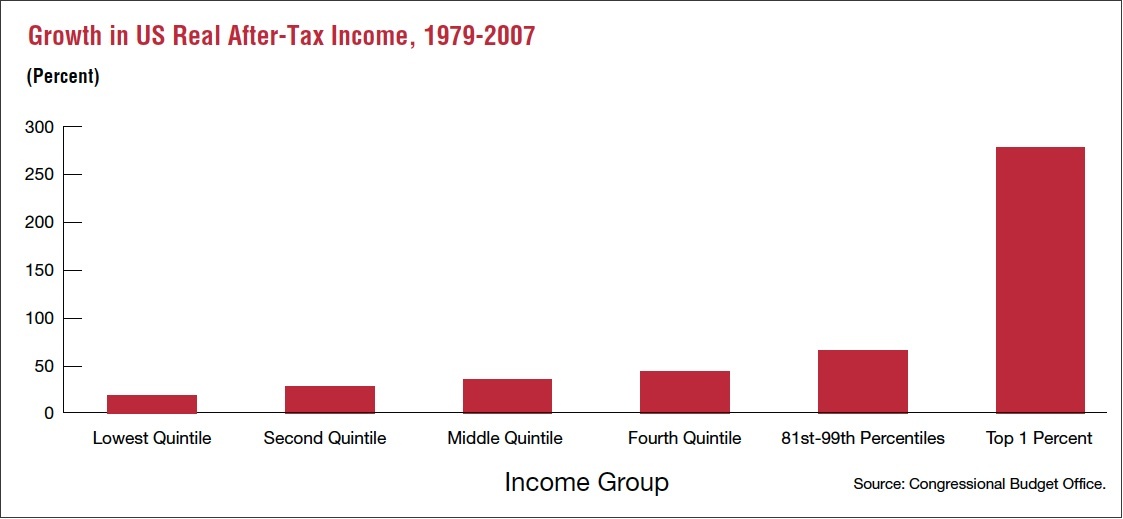
Source: Source: Congressional Budget Office
One reason is the dramatic change in the world labour market as China and India have turned the pool of labour into an ocean. The direct effects of this competition are obvious. Whole industries in the west have been wiped out. A small village in China had a few people who made socks as a sideline; it now makes over a third of all the socks worn in the world. Textile industries in the west have been massively cut back.
But as well as these direct impacts there have been indirect impacts as well. Western companies who want to survive have been spurred on to cut their labour costs in an effort to compete. Either investment in equipment, which cuts the hours, needed, or relocations to cheaper places, or hard bargaining are just some of the tools used to try to stay in the game.
It is not just companies who have felt the need to respond. Governments have changed the law to make it easier for firms to get cheaper labour. In some countries such as Britain, this was a direct response to fears that unions had become too powerful and needed to be restrained. In other countries such as Germany, it was the desire to price workers out of unemployment and into jobs, which led to cuts in benefits and put downward pressure on wages.
On top of this we saw the rise of the influence of central banks tasked with maintaining low and stable inflation. It’s usually assumed that this policy has nothing to do with distribution because inflation affects all. But that’s not true because of the way that central banks have looked at the nature of inflation. When they speak of inflation, many central banks actually look at what is happening to domestic costs and when they think of domestic costs they think of wages.
What does this mean in practice? It means that there is a tendency for the central bank to tighten policy if wages rise but not if profits rise. This amounts to saying that central banks have a de facto bias to reducing that share of wages in the economy and increasing the share of profits.
Politics has not reversed this trend to greater inequality, indeed it has intensified it. Tax cuts have greatly increased inequality because they benefit most those with most money. And the structure of the tax system makes the position of those at the top particularly advantaged. They get a much higher proportion of income from capital gains, which often attract a lower tax rate. That is why Warren Buffet has a lower tax rate than his secretary.
How has all this worked out in practice? This article makes no attempt to assess whether the increased inequality is a good or bad thing as far as society is concerned. Nor is it concerned with whether the rewards at the upper end of the scale are unjustified in the way that critics suggest. It is concerned with the economic implications of an economy where the mass of consumers have stagnant or falling incomes even though the economy seems to be expanding.
The first question is how is the expansion to be maintained. How do retired car workers keep buying when the pensions they receive are being cut? Until 2007 the US thought it had the answer.
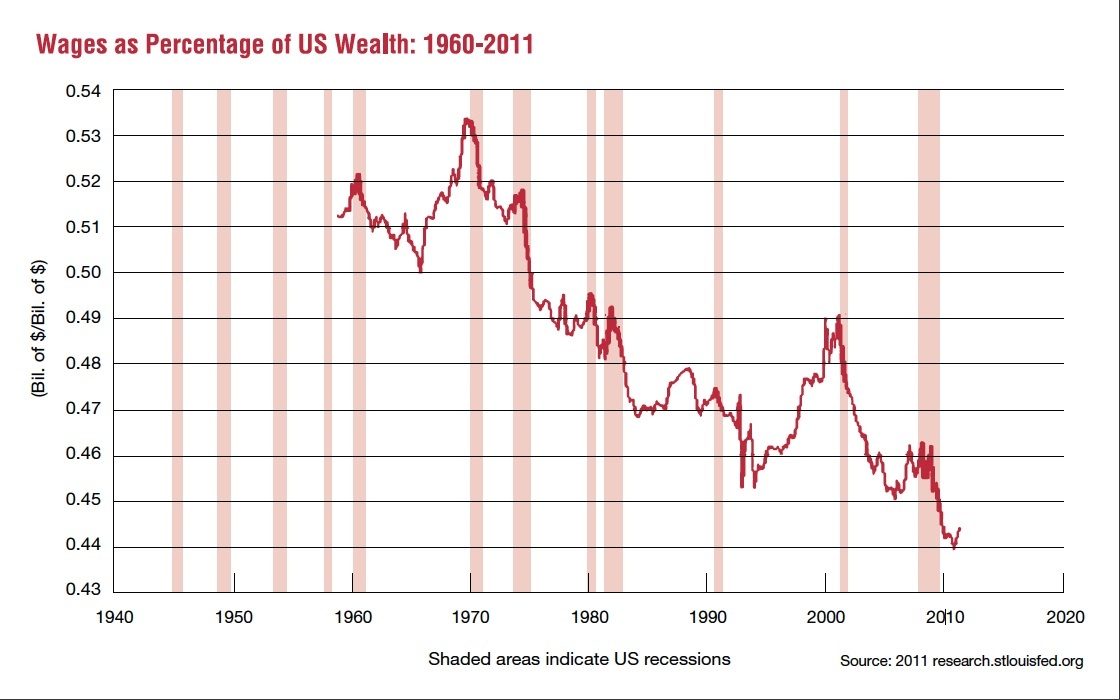
Source: 2011 research.stlouisfed.org
Get them to borrow money and tell them they can make a fortune by buying a house. As more people are induced to do this, house prices do indeed rise and more people get sucked in.
Essentially this meant lending money to people who did not earn enough ever to pay it back. This stopped when it suddenly dawned on the world that if people couldn’t pay the banks then the banks couldn’t pay them. Like all things that cannot continue forever, it stopped.
If all that happened was a short sharp recession as a result of that, there would be a lot less reason to worry. But what’s actually happened is that we have been forced to face a problem which the debt bubble concealed for a few years.
In the current state of the world economic system, all the pressures lead to greater inequality in earnings. But that greater inequality deprives the majority of the purchasing power needed to create demand. Although the new rich in particular have made herculean efforts in some cases to consume enough to make up the gap, they have failed to do so.
There are eerie overtones here of Marx’s warnings of how capitalism would dig its own grave. The pressure for ever higher profits would force down wages. And lower wages would eventually produce a glut of goods that the workers could not afford to buy. (Interestingly Malthus, usually associated with the worry that population would be too be big for the food supply, was also worried that there would be a crisis from lack of demand because people couldn’t afford to buy.
Western society in the 30 years after the war seemed to have definitively refuted Marx’s thesis. Society became richer and more equal at the same time. Production and consumption marched hand in hand.
It’s unlikely we will see that in the near future. What’s more likely is a further intensification of downward pressures on wages and other labour costs as the traditional industrial countries try to hold on to markets in the face of the advance of the new economies. It will not be a comfortable time.
David Blake is a financial analyst and commentator.